Crypto volatility daily tracker
Top Daily Crypto Volatility
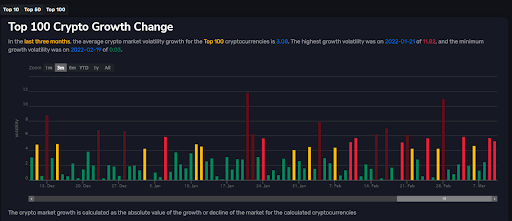
In the , the average crypto market volatility growth for the cryptocurrencies is . The highest growth volatility was on of , and the minimum growth volatility was on of .
The daily crypto volatility tracker is calculated as the absolute value of the growth or decline of the market for the calculated cryptocurrencies
Cryptocurrencies price volatility
Cryptocurrencies price volatility represents the average of how much it grows or declines each day, for the selected period, on an absolute value.
Overview of Crypto Market Volatility
Volatility, in standard terms, measures the dispersion of returns given a specific market index. But defining it in more simple terms is simply the variation of prices during a given timeframe.
Why is volatility significant? Because it is considered as a tool to evaluate riskiness: the higher the volatility, the riskier the asset.
Even if volatility is used in both traditional and more innovative markets, cryptos need specific considerations: the Crypto Market Volatility Index helps us do this.
Is volatility bad?
Usually, volatility is considered one of the worst characteristics of any investment, but the truth is that there is no definite answer when it comes to crypto volatility.
Cryptocurrencies need a different attitude from that kept with stocks: in the crypto space, volatility is what attracts more traders and investors.
This happens because volatility is what allows higher returns – but also higher losses. That’s why cryptos need more discipline and more robust market knowledge.
Stock Market vs. Crypto Volatility Index
The most widely used index for stock volatility is the CBOE VIX – Chicago Board Options Exchange Volatility Index, called The VIX.
This index is calculated considering the price changes of the SPX – the S&P 500 index – options in the short term.
This index is a valuable tool because it measures traders’ and investors’ sentiment. If you analyze this index, you’ll realize that when market participants are afraid of market developments, the VIX is high and volatile. It becomes the tool that tracks uncertainty. But when it comes to cryptocurrencies, volatility is more an intrinsic feature.
Apart from stablecoins, cryptocurrencies tend to be volatile for the simple reason that there are fewer participants. The crypto market is less liquid than the stock market. It is far easier for single traders and investors or institutions to manage to influence the market. And since the price of cryptos depends exclusively on demand and supply, volatility becomes something inevitable: it doesn’t measure uncertainty. It is just the natural consequence of the forces that drive the market.
What is the Crypto Volatility Index?
Despite what we explained so far, not all cryptos are equal: factors like the limitedness of supply, or mechanisms like fee-burning, can adjust volatility.
So, even if volatility in the crypto market is quite average, it is still helpful to calculate it to evaluate different projects and allow traders and investors to include a risk tracker in their strategies.
The Crypto Volatility Index tells you the level of volatility in the market: this indicator usually considers the last 30 days, but Top Coin Crypto Price found a way to give more short-term info, so you can use this indicator also if you’re a short-term trader.
How is the Volatility Index calculated?
Top Crypto Coin Price gives you two charts to evaluate crypto volatility: the Crypto Market Volatility and the Crypto Volatility Index.
So, even if volatility in the crypto market is quite average, it is still helpful to calculate it to evaluate different projects and allow traders and investors to include a risk tracker in their strategies.
The Crypto Volatility Index tells you the level of volatility in the market: this indicator usually considers the last 30 days, but Top Coin Crypto Price found a way to give more short-term info, so you can use this indicator also if you’re a short-term trader.
Crypto Market Volatility
Let’s see the definition of this indicator first:
The crypto market growth is calculated as the absolute value of the growth or decline of the market for the calculated cryptocurrencies.
The Crypto Volatility Index tells you the level of volatility in the market: this indicator usually considers the last 30 days, but Top Coin Crypto Price found a way to give more short-term info, so you can use this indicator also if you’re a short-term trader.
As you can see, you can decide how many cryptos the chart should show and the timeframe:
- You can choose among Top 10, Top 50, and Top 100 cryptocurrencies;
- The timeframes are one month, three months, six months, YTD (Year to Date), one year, or you can choose to see all data available.
This indicator shows the average volatility of the crypto market according to the specific timeframe. A particular feature of Top Crypto Coin Price is that you can see 24-hour crypto market volatility, while other popular indicators only show volatility starting from a 1-month timeframe.
As the formula assesses, the indicator considers the absolute value – that is, it doesn’t matter if the volatility increases or decreases. You’ll get an average value with no positive or negative sign to evaluate how the market is doing.
At the beginning of the chart, you will also see a little recap – that will vary according to the timeframe you consider.
Crypto Volatility Index
The formula is more complicated, but it’s the standard formula to calculate the crypto volatility index:
The crypto market volatility index is measured by using the standard deviation or variance between returns from the calculated cryptocurrencies.
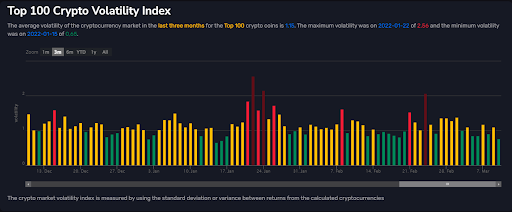
But also, in this case, Top Crypto Coin Price calculates volatility for a shorter timeframe – 24 hours. That’s why we need to introduce this element in the formula since volatility is calculated considering hourly coin price change:
Var (Variance) = ∑(Top 100 Crypto Price Change at N)^2 / (24 * 100)
So, considering the top 100 coins:
- ∑ is the summation sign – that is, you sum all values that follow;
- N is the specific hour;
- The price change is calculated as the difference between the opening price and the price of that crypto at N;
- 24 represents the number of hours in a day – as we said, Top Crypto Coin Price calculates daily volatility.
Also, in this case, you’ll find a short recap according to the timeframe you choose.
How to read the crypto volatility charts
Top Crypto Coin Price shows you colored bars that will show you at a glance what’s the level of volatility of the crypto market:
- Dark red: very high volatility;
- Red: high volatility;
- Dark red: very high volatility;
- Yellow: medium volatility;
- Green: low volatility.
You’ll also find a section dedicated to single cryptocurrencies between the charts, which you can easily navigate thanks to the search bar.
Top volatile cryptos of the past week
| Coin | Last Price | Change (%) |
|---|---|---|
| $40.53 | 8.43 | |
| $2.27 | 7.94 | |
| $1.24 | 6.35 | |
| $2.61 | 5.66 | |
| $0.5891 | 4.95 |
Volatility is a helpful indicator to measure price variations easily. The crypto market is more volatile than the stock market – even if some projects use mechanisms to reduce it – because of the fewer participants.
Every trader has specific strategies: those who prefer low volatility to keep a stable portfolio, those who prefer speculation, those who diversify their portfolios by adding cryptos with different levels of volatility. The volatility index will tell you how risky an asset is, and Top Crypto Coin Price will also allow you to get short-term info that you won’t find elsewhere.
Updated